Pipeline Coverage

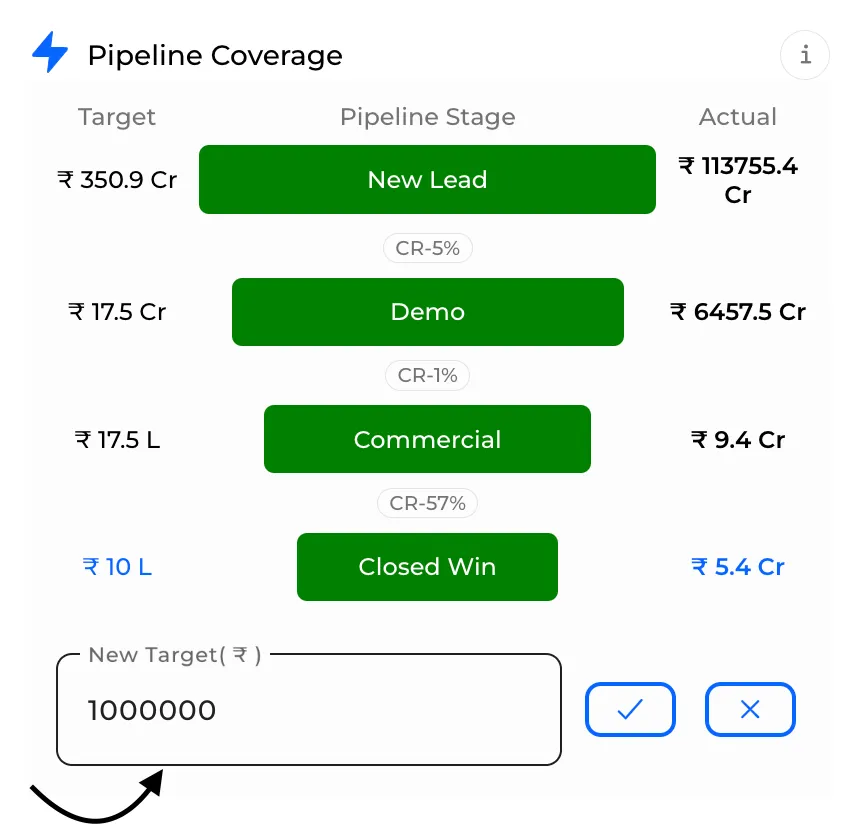
Click on edit.

Give Target Value.

Click on the tick mark.

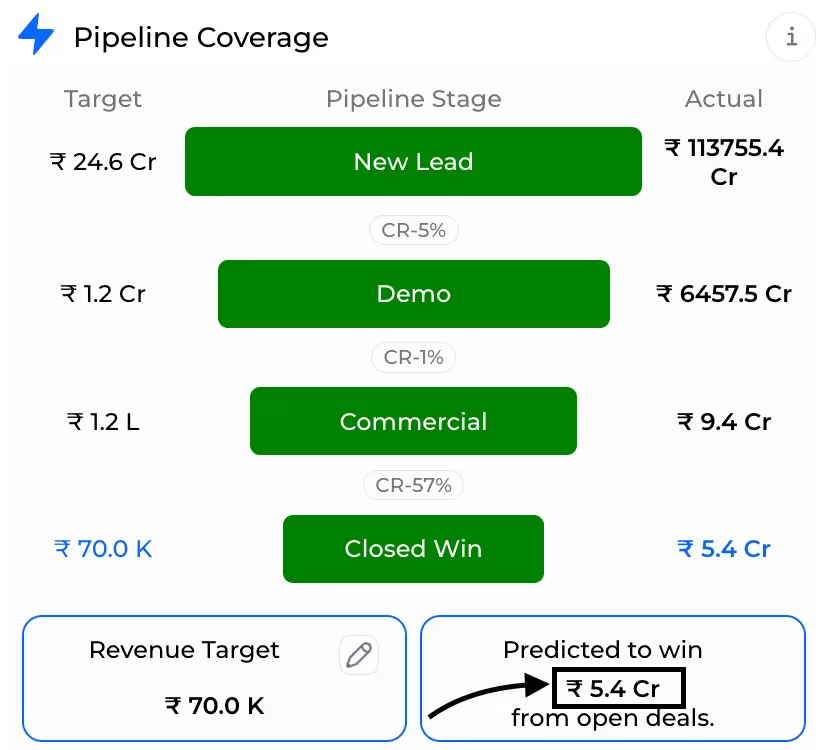
5.4 cr is the projected revenue for revenue target of 70 k using history % of win conversion.
As actual new lead is more than target value of predicted so we achieved new lead so it is green.same in rest other cases.

5.4 cr is the projected revenue for revenue target of 7 cr using history % of win conversion.
As actual new lead is more than target value of predicted so we achieved new lead so it is green.same in demo stage case as well. But in commercial we need 12.3 cr as per history actual amount is 9.4 cr so here it is red as it is not achieved.
- Predicted to win: according to your history prediction of winning deal is calculated and displayed.
- When you give target revenue it will predict according to your history it will predict to win.
- Target is calculated on history %.
- Actual is current value at that time only win will be calculated on the basis of current stages with respect to history.
%201.svg)


.svg)


.svg)