%201.svg)
Dashboard
- Which shows the progress or the current status of all the activities taking place like, field visits, calls , meetings , deals , company and contact generation and few of the summarized analysis on deals.
- All these are categorized into Key Performance Indicators(KPI’s) and tables which are visualized in the form of charts, graphs and tables.
My DashBoard
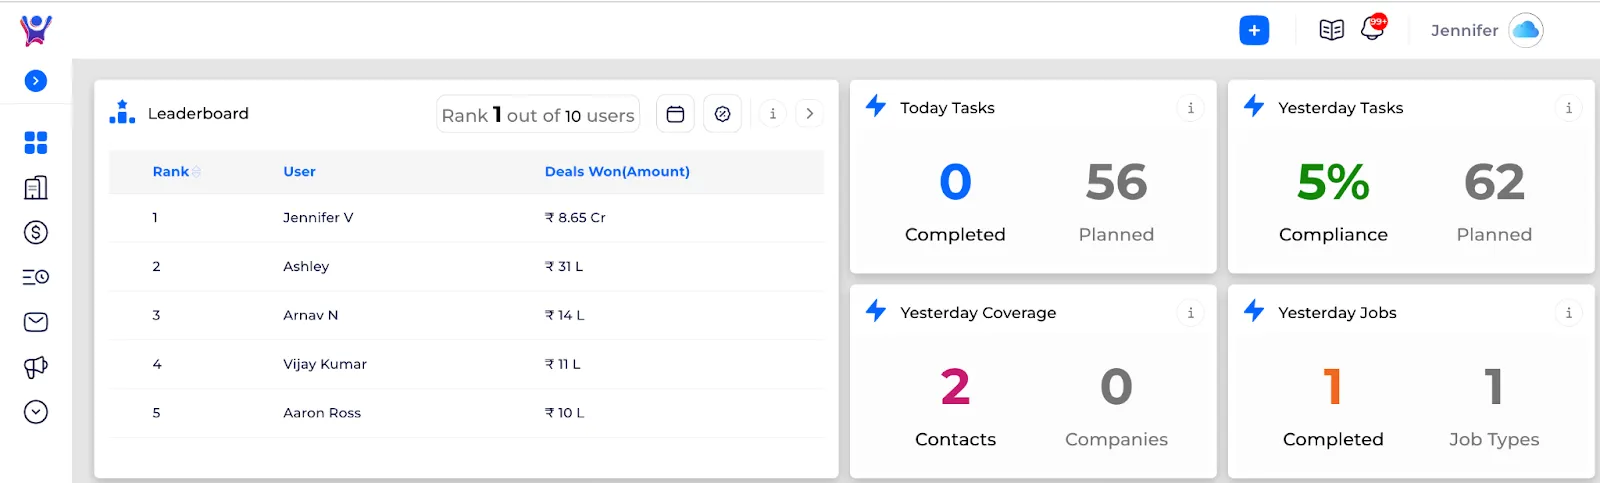
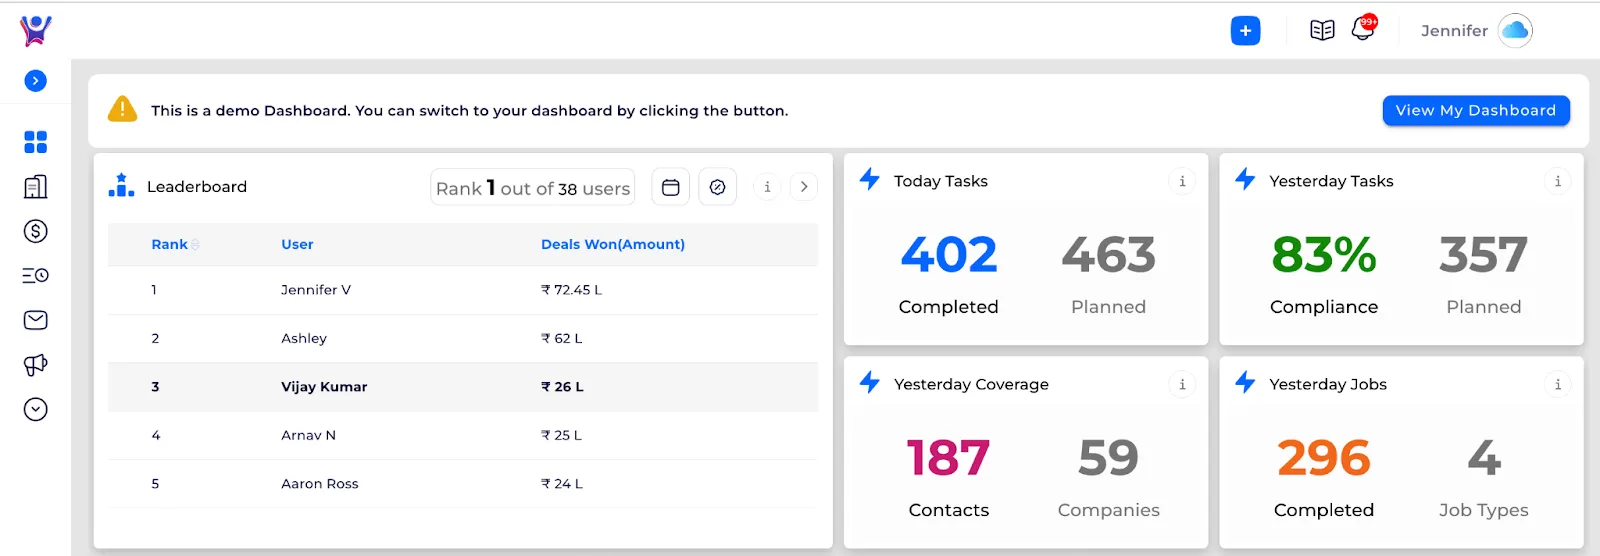
In my dashboard every KPI/ Card is related to his performance , compliance.
- Today's task- here total tasks scheduled for today and completed will be shown.
- Yesterdays tasks-here total tasks scheduled yesterday and completed will be shown.
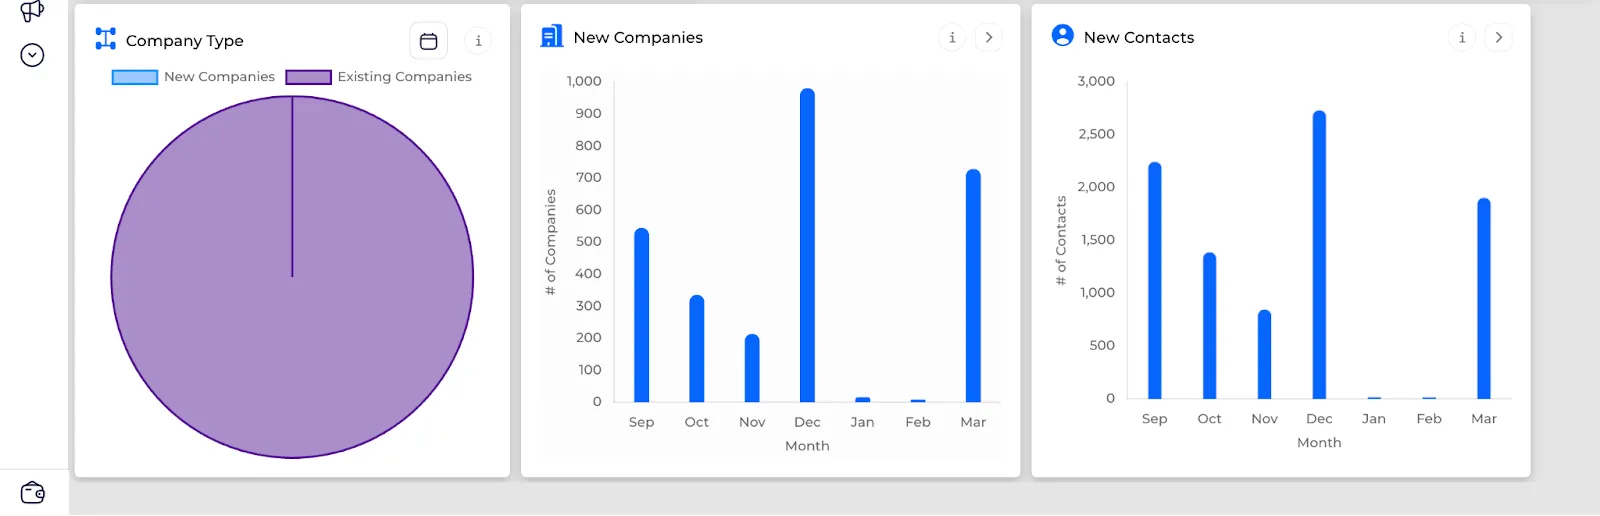
- New contacts - contacts added -shown month wise.
- New companies - companies added -shown month wise.
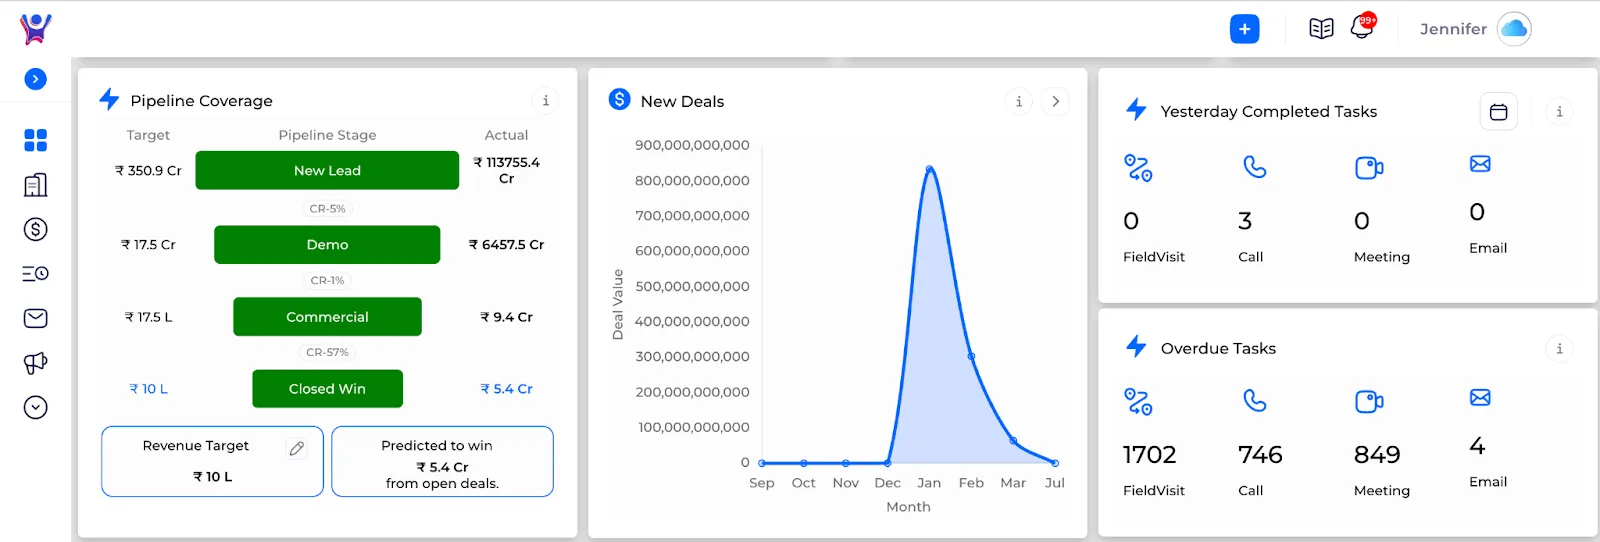
- New Deals - No of deals created -month wise.
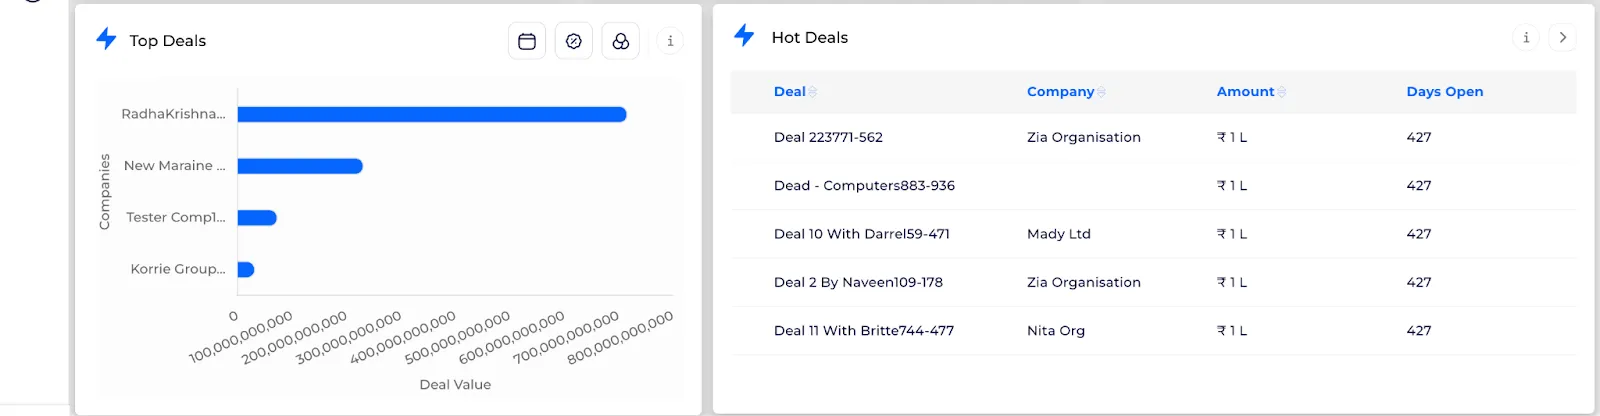
- Top Deals - list of top 5 companies which won most deals.
- Hot Deals - List of deals which were open for so long
Demo Dashboard
- Initially a demo dashboard is shown which consists of static or fixed data to show the look of all the kpis, charts and tables when they have enough data.
- Both demo and original dashboard looks the same where only difference is demo dashboard is generated with fixed data and original dashboard is generated with original and updated data of the user.
- On clicking View My Dashboard, the user dashboard will be shown.


.svg)


.svg)